
High-Level Project Summary
I have developed an application that displays relevant space weather data in an intuitive and simple way, adding visual and auditory elements so that the user sees, hears and feels the effects of space weather.It also shows a lot of information about some of the missions that are currently investigating and observing the solar wind and the impact it has on the earth and space weather.You can try in http://nasasolarwind.000webhostapp.com/
Link to Final Project
Link to Project "Demo"
Detailed Project Description
You can try in http://nasasolarwind.000webhostapp.com/
It shows information about the sun in different channels that many of the users do not know and the benefits of being able to see it in that channel. They can be changed manually and also at each access one is shown randomly.


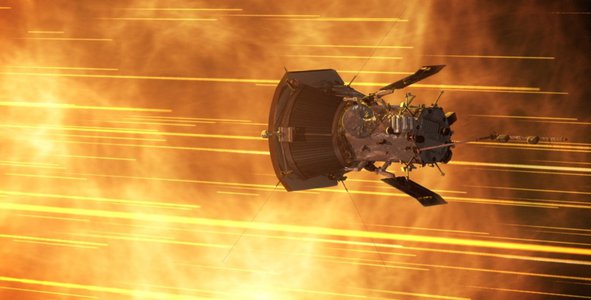
We show and detail many of the current missions that are observing the sun and space weather, providing very interesting information to users and space lovers. You can click on each satellite and see the information and real images, apart from this, depending on the conditions of the solar wind, you can see how they move.


It is explained what the solar wind is and how it affects space weather.

An equivalence of wind speed has been made to run an audio file that simulates the noise generated on a human scale, making it easier to understand.


Depending on the temperature of the solar wind, the color of the upper bars of the elements changes, being able to see the changes in temperature visually.
Different phrases relevant to space exploration are shown.
All elements on the screen have information points.
 Additionally, an explanation screen of what we can do in the application has been added.
 To access you just have to access the web
I hope to bring all this information to the general public and give them an idea of all the space weather, sun and space wind analysis projects out there and their importance. All this in a close and simple way.
Angular has been used for web development
Space Agency Data
I have accessed NOAA data to show the temperature and speed of the solar wind.
https://services.swpc.noaa.gov/products/solar-wind/plasma-2-hour.json
From this page I was inspired by the ease of access to data and the simplicity of use.
I have consulted the complete list of space missions to add information and images of each satellite
https://www.nasa.gov/missions/
It made it very easy for me to access the complete list of missions and be able to see and understand what each one of them does
The images of the sun have been obtained from the SDO mission
https://sdo.gsfc.nasa.gov/data/
I have loved all the channels of visualization of the sun and what each one of them contributes
The sounds have been taken from free internet resources
Hackathon Journey
The challenge has been difficult but rewarding and has allowed me to study and learn new things about all the missions that are currently studying the solar climate and their impact on the earth. I would have liked to have more time and add things that have been left on the TODO list, but the result has been good.
References
The code has been developed entirely by me.
The images of the sun:
From the SDA mission: https://sdo.gsfc.nasa.gov/data/
The satellite images have been obtained from:
Wikipedia: https://es.wikipedia.org/wiki
Y
https://science.nasa.gov/heliophysics/mission-fleet-diagram
Some PNGs have been taken from: https://www.freepng.es/
The sounds have been obtained under a free license from: https://www.videvo.net/en/sound-effects/wind/freeclips/yes/
Tags
#solarWind #spaceWeather