Awards & Nominations
Selene has received the following awards and nominations. Way to go!
 Galactic Impact
The solution with the most potential to improve life on Earth or in the universe.

Selene has received the following awards and nominations. Way to go!
The solution with the most potential to improve life on Earth or in the universe.
Apollo missions were conducted from 1968-72, but until now, the seismic data retrieved from it has never been visualized in a 3D environment. Hence, we have developed an interactive web app. We plot an animated seismic wave on a 3D globe of the Moon based on the date provided by the user as input. When the user provides year and day, an animated pressure gradient wave is rendered on the respective latitude and longitude along with its details.
Apollo crewed missions were conducted from 1968 - 1972. The astronauts left behind several seismometers on the Lunar surface to track the geophysical events occurring on the moon. These seismometers sent back data to earth and were recorded in exabyte tapes. The data has since been studied extensively by scientists to know more about the internal structure of the moon. Although the data has been available for a long period of time, we could not find any tool that can plot and visualize the propagation of the seismic wave in an interactive environment.
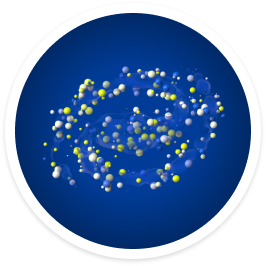
 We have created 'Moonquake Visualized' a web app to enable users to look at the different seismic activities on the Lunar surface. When the user provides the Date (year & day) as input, the corresponding latitude and longitude along with the details associated with the moonquake on that date are fetched from the database. After receiving the coordinates, an animation of a pressure wave designed in Blender is displayed on a 3D globe rendered in ThreeJS. The size of the pressure wave is dynamic and is calculated based on the magnitude of the moonquake.
When you first open the website, you will be welcomed with a landing page. On clicking the 'visit moon' you will be directed to the main interface. Here you will find many parameters for adjusting:
From the drop-down menu, the user can select the timing of the moonquake they want to see and the corresponding seismic wave will be rendered on the globe. We have added flexibility for the user to switch between a default map and a height map. Latitude and longitude grids can also be switched on or off from there.
Our project solves the challenge by providing a 3D interface for the users to visualize the seismic activity on the moon. It helps better understand how moonquakes differ from earthquakes in terms of magnitude and propagation. The latitude and longitude grids help identify the precise location of a place. The height map of the globe allows the user to better understand the topography of the Lunar surface. It will also help NASA in the upcoming Artemis mission where the data from the new mission could be processed and displayed. This project provides an interactive app to make the general public aware of the landscape, geography and seismic activity on the moon.
 We hope the project generates an impact, that the younger and mature audience both get to know more about the Moon which is thought to be very inert. It will enable everyone to look at the far side of the moon which they have never seen. The First-Person-View was created to give our audience a feeling of what the astronauts saw walking on the moon, what the lunar lander looked like and how a moonquake would feel if they were on the lunar surface. We hope they find it fascinating and it helps them increase their knowledgeand generate interest in the subject.
We have made a python script to plot the raw seismic vibrations the seismometers picked up. The user can input any start and end time in UTCDateTime format and the raw data will be displayed for them to inspect.
 TOOLS USED TO DEVELOP THE PROJECT
The project was developed using:
Link to the project: GitHub
We had an amazing time completing the Spaceapps challenge this year. Our team had never worked before on a 3D project, but we were determined to make this project come to life for the sheer impact it will generate. While doing our research we were surprised that we knew absolutely nothing about the Moon! The same moon which we have been looking at every night. This was enough to give us the motivation to complete this challenge. We have learned a lot about 3D modelling, the Moon and its internal structure, which we would now like to share with everyone.
Although everyone was working on a different part of the project, from data processing to creating animation to finally compiling everything into one, all of us shared the same spirit and enjoyed this journey to it's fullest.
Catalog of Lunar Seismic Data from Apollo Passive Seismic Experiment on 8-mm Video Cassette (Exabyte) Tapes- https://nssdc.gsfc.nasa.gov/misc/documents/b53211.pdf
ObsPy: A Python Toolbox for seismology/seismological observatories(mod by isas-yamamoto)- github
APOLLO SEISMIC DATA ANALYSIS IN PYTHON: OBSPY MODULE AND RESPONSE FUNCTION- https://www.hou.usra.edu/meetings/lpsc2019/pdf/2492.pdf
#Moon #Lunar #Geophysics #3D #WebApp #ReactJS #Blender