
High-Level Project Summary
Our Disease Forecast is proposed to warning of the disease epidemic explosion, in the form of a universal signal format.This is to scientifically identify and forcast that the date , time and location of the outbreak, the infection explosion of COVID-19 positives.Accuracy rate(R2) 84.8%(up 09/12/2022)The method uses a combination of satellite data(Sentinel-5P:measuring air pollution) and All over the world ground data(measuring air pollution) for analysis, enabling predictions up to three months ahead. COVID-19 is disrupting everyday life around the world and devastating the world's economies. For this reason, the world needs accurate, science-based forecasts.
Link to Final Project
Link to Project "Demo"
Detailed Project Description
[we do]
We Disease Forecast are working on the CAPACITY BUILDING RESOURCES GATEWAY Challenge. Specifically, we are working on Disease Forecast COVID-19 forecasting.
Accuracy rate(R2) 84.8%(09/01/2021 - 09/12/2022)
 [Basis foundation]
COVID-19 is currently at epidemic levels in Japan and all of the world, and is seriously affecting everything from everyday life to national economies around the world.
Manually collecting data on COVID-19 is time-consuming and hinders the health sector's ability to address the threat. It has become clear in recent years that the number of COVID-19 positive is correlated with air pollution, particularly PM2.5 and NOx.
[How does it work]
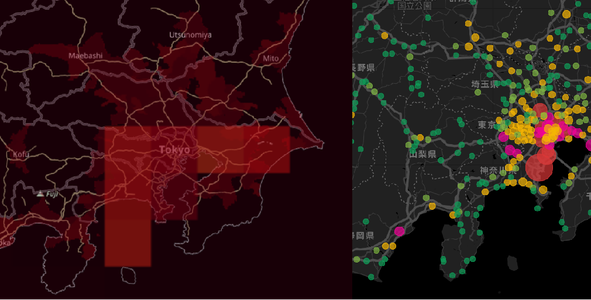
Our portal is proposed that correlates the number of COVID-19 positives with satellite data and real-time data from the ground, indicating the timing of the COVID-19 outbreak and the number of potential positives and hotspots three months in advance.
Accuracy rate(R2) 84.8%(up 09/12/2022)

[What do you hope]
The portal, which is open to the public, is targeted at government public health departments and local government agencies to provide advance notice of COVID-19 outbreaks and assist in prioritising resources.

[Our project]
Logically, the solution works by means of a data set as follows The target is our home country of Japan, in particular Tokyo.
First, from the correlation of the above air pollution data and the data on the number of positive COVID-19 cases up to 2020 and 2022.
We will create a forecast of the number of positive cases in winter 2022-23.
Worsening air pollution spreads infection, which in turn spreads disease.
Trends in air pollution data will alert the public about this year's trends three months in advance, so that COVID-19 measures can be taken in good time.
Positive count projections and cases are reported to public health authorities and
Therefore, scientifically correct forecasting three months in advance can help address and disrupt the disease cycle before the epidemic spreads.
Space Agency Data
 [Our trigger 】
Various media reported that air pollution has improved as a result of the new coronavirus.
https://www.bbc.com/news/world-asia-51691967
For example, the following BBC and Earth Observatory articles indicate that urban lockdown has improved air pollution.
https://earthobservatory.nasa.gov/images/146596/airborne-particle-levels-plummet-in-northern-india
We thought, "The cause-and-effect relationship is it the other way round?
We thought lightly and started to look into previous studies.
https://www.nasa.gov/press-release/nasa-partner-space-agencies-amass-global-view-of-covid-19-impacts
Hackathon Journey
The Space Apps experience was exciting and inspiring.
(Slightly bittersweet andTough)
Because policy makers are so busy with their own work day in and day time.
We sympathised with the fact that they are forced to focus only on what is in front of them,
and felt the need to show their work from a bird's eye view from space, which is why we chose the project.
To develop this project, we took an analytical approach by combining and correlating satellite data (Sentinel-5P) and ground-based data on the number of COVID-19 positives and air pollution.
Our team has been able to predict the number of COVID-19-positive from air pollution,
someome ridiculous , for more than one year. But we trusti the results of many previous studies (all peer-reviewed papers)
So, we to be more scientific and accurate than human flow forecasts! .
Accuracy rate(R2) 84.8%(up 09/12/2022) Human flow (MAX R2): 60.8%
 Thank maika for her support in this project, and for her support in complying with the correct previous research and sticking to it.
References
https://earthobservatory.nasa.gov/images/146596/airborne-particle-levels-plummet-in-northern-india
https://www.nasa.gov/press-release/nasa-partner-space-agencies-amass-global-view-of-covid-19-impacts
[Analysis]
https://worldview.earthdata.nasa.gov/
https://developers.google.com/earth-engine/
[NO2 & PM2.5 Data]
https://so2.gsfc.nasa.gov/no2/no2_index.html
the World Air Quality
https://aqicn.org/data-platform
[Prior research]
https://pubmed.ncbi.nlm.nih.gov/35442452/
https://www.kyoto-u.ac.jp/ja/research-news/2021-02-04
[japanese]
そらまめくん
https://soramame.env.go.jp/apiManual/apiPage3/api-3
国立社会保障・人口問題研究所
Source: National Institute of Population and Social Security Research.
https://www.ipss.go.jp/projects/j/Choju/covid19/index.asp
NHK COVID-19 Special feature website
https://www3.nhk.or.jp/news/special/coronavirus/data/
[GIthub]
https://github.com/miraimeisatu/Tokyo_cup20211219
Tags
#COVID-19, #python, #javascript, #html, #css, #sentinel, #NASA ,#AQI, #soramame