
High-Level Project Summary
Methane (CH4) is is the second-most important greenhouse gas after carbon dioxide (CO2), accounting for 16–25% of atmospheric warming to date (ref 1, 2, 3). We developed a web portal that allows the visualization of yearly methane behavior using satellite monitoring and Canada data to show the distribution of methane in the atmosphere in different ecosystems. We believe our approach to solve the challenge will help raise awareness about methane emissions, providing users information that help catalyze global action and strengthening existing international methane emission reduction initiatives.
Link to Final Project
Link to Project "Demo"
Detailed Project Description
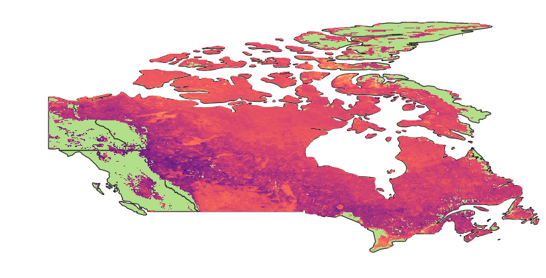
MethaneXplorer is a web portal that contains information regarding methane in the atmosphere. We used satellite data and ground measurements as input to generate information about the spatial distribution of methane in Canada. One of the datasets that were ingested was obtained by the Sentinel-5 mission, part of the European Earth Observation Programme "Copernicus" which is a coordinated and managed by the European Commission (EC). The space component of the Copernicus observation infrastructure is developed under the aegis of the European Space Agency (ESA) (ref. 5).
The Copernicus Space Component comprises a series of space-borne missions called 'Sentinels' that are developed and procured by the European Space Agency. The missions Sentinel-4, -5 and -5 precursor (S4, S5, S5P, respectively) are conceived as complementary elements of a constellation serving the specific needs of the Copernicus Atmospheric Monitoring Services (CAMS). These services will provide coherent information on atmospheric variables in support of European policies and for the benefit of European citizens and will cover ozone and surface UV, air quality, and climate applications. Sentinel-5 is focused on air quality and composition-climate interaction with the main data products being O3, NO2, SO2, HCHO, CHOCHO and aerosols. Additionally Sentinel-5 will also deliver quality parameters for CO, CH4, and stratospheric O3 with daily global coverage for climate, air quality, and ozone/surface UV applications (ref 5).
The dataset was accessed through the Google Earth Engine API and its online editor. We decided to use yearly data, because the database and computer power required to process all the images, exceeded the capacity required by the challenge at hand. However, we plan that in the future this process can be automatized and monthly and daily maps can be distributed freely. We decided to show the resulting maps as images, however, in the future we plan to give GIS capabilities to the site, so people can make decisions based on the information provided. We used QGIS to create the maps and GEOServer to export the geo-databases through a Web Mapping Service (WMS).
We used data of the Atmospheric Chemistry Experiment (ACE), which is a Canadian satellite mission for remote sensing of the Earth's atmosphere that was launched into a high-inclination (74°), circular low-earth (650 km from the surface) orbit on August 12, 2003 (ref. 6). This orbit gives SCISAT coverage of tropical, mid-latitude, and polar regions, ranging from latitudes 85N to 85S, allowing it to study a range of atmospheric processes. The main goal of ACE is to study the atmospheric chemistry and dynamics that affect stratospheric ozone depletion in the Arctic, but ACE measurements are also being used to study ozone depletion in the Antarctic, the relationship between chemistry and climate change, the atmospheric effects of biomass burning, the effects of aerosols and clouds on the global energy balance, and many other areas of atmospheric science.
The data was segmented to Canada using QGIS and we extracted the column mixing ratio of the methane (ppv) in the 150 km column. The data was a set of observations which had a lot of "holes" in time and space, so we decided to show the ppv values above the ecosystems in Canada. These ecosystems were spatialized in QGIS and used data of the NRCAN which showed fifteen ecozones that make up terrestrial Canada, and five make up the marine waters bordering Canada. Canada’s 15 terrestrial ecozones can be subdivided into 53 ecoprovinces, which can be further broken into 194 ecoregions. We used the ecozones because they were useful for general national reporting and for placing Canada’s ecosystem diversity in a North American or global context (ref. 7). The data was tabulated and presented in graphs.
Space Agency Data
We used the European Space Agency data from the Sentinel 5 mission, whose main objective is to perform atmospheric measurements with high spatio-temporal resolution, to be used for air quality, ozone & UV radiation, and climate monitoring & forecasting. We used the Earth Engine (EE) Code Editor (code.earthengine.google.com) as a web-based IDE for the Earth Engine JavaScript API, where we used the dataset COPERNICUS/S5P/OFFL/L3_CH4 to perform spatial operations regarding the CH4_column_volume_mixing_ratio_dry_air variable. We also used the Atmospheric Chemistry Experiment data that is onboard the Canadian SCISAT-1 which was measuring vertical profiles from the upper troposphere to the lower mesosphere for a large number of atmospheric constituents.
Hackathon Journey
Thank you for opening a chance to explore data, it has been a wonderful experience. In this 2 days I was able to explore chemistry datasets that prove to be high quality data to generate information that can reach non academic people and make an impact, especially in the climate change area. We were inspired because of the lack of visual information regarding methane distribution around Earth, especially in Canada, where SCISAT is data is freely available, and since there are few portals that show this, we focused our approach in the maps and graphs that show this distribution.
References
- IPCC Climate Change 2014: Synthesis Report (eds Core Writing Team et al.) (IPCC, 2014).
- Etminan, M., Myhre, G., Highwood, E. J. & Shine, K. P. Radiative forcing of carbon dioxide, methane, and nitrous oxide: a signifcant revision of the methane radiative forcing. Geophys. Res. Lett. 43, 12614–12623 (2016).
- Rosentreter, J. A., Borges, A. V., Deemer, B. R., Holgerson, M. A., Liu, S., Song, C., ... & Eyre, B. D. (2021). Half of global methane emissions come from highly variable aquatic ecosystem sources. Nature Geoscience, 14(4), 225-230.
- Dlugokencky, E. J. Trends in Atmospheric Methane (NOAA/GML, 2021); www.esrl.noaa.gov/gmd/ccgg/trends_ch4/
- https://sentinel.esa.int/web/sentinel/missions/sentinel-5
- Bernath, Peter (2006), Atmospheric Chemistry Experiment (ACE): Analytical Chemistry from Orbit, Trends in Analytical Chemistry, Vol. 25, No. 7, pp. 647-654.
- https://open.canada.ca/data/en/dataset/d9df394f-8893-11e0-bc90-6cf049291510
Tags
#Sentinel5 #Canada #SCISAT #CSA