
High-Level Project Summary
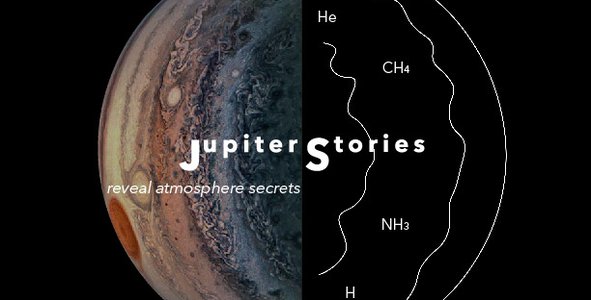
Jupiter Stories is an immersive way of scientific storytelling revealing Jovian atmosphere secrets. Our project focused on analyzing the elemental composition of Jupiter’s atmosphere by using images taken from the Juno spacecraft and either putting them in false color or running them through a neural net algorithm. Comprehending Jupiter’s meteorology is essential for scientists to learn about the weather dynamics on various planets. Our solution is a creative way of visualizing the data made accessible for scientists and space enthusiasts in a curated and creative manner. The website design and proposed AR/VR experience are designed with contrasting colors to increase accessibility.
Link to Final Project
Link to Project "Demo"
Detailed Project Description
Our project mission was to come up with something that could explore the composition of Jupiter’s atmosphere. We wanted to use Juno imagery to pick apart the different colors found on Jupiter’s surface and determine what elements they were made of. Jupiter’s atmosphere is composed of hydrogen (~90%), helium (~9.9%), ammonia, methane, and water (~combined 0.1%). The mixture of these elements can lead to different colors showing on the surface, and may give us clues as to how Jupiter’s atmosphere is arranged.
Our project consists of essentially two parts: a website, AR/VR experience, and a codebase example: (https://www.figma.com/file/WLxoAEQrWMZ4Jb3RQ9Km35/Jupiter-Stories?node-id=0%3A1 Press the play/present button in the corner to view the website fully). The website provides imagery examples of the two types of analysis that we wanted to attempt during this hackathon: false color imaging and machine learning and categorize them in a comprehensible manner.
One way to analyze the contents of Jupiter’s atmosphere is to false color the images provided by the Juno spacecraft. Jupiter’s surface storms provide striking patterns of flowing gasses, whether they be currents at the equator or around the Red Spot, or cyclones at the poles with lightning storms. False coloring these images makes certain aspects of the surface “pop” in an unexpected color, and can show less obvious details that might have been hidden away in the swirls of clouds. It is very possible that different colors on the surface of Jupiter’s clouds correlate to different elemental compositions within those clouds. The poles in true color appear dark blue whereas the rest of Jupiter has bands of orange, beige, yellow, and red, with darker blue stretches throughout. We achieved false color by using QGIS, an open source geospatial analysis software usually used for analyzing Earth based geospatial data but which can be used for other applications. Specifically, we used the Semi-Automatic Classification Plugin (SCP) to swap RGB (red, green, blue) bands to create the false color effect. Jupiter’s typically red clouds can appear green or blue when different colors are assigned to different bands.
False coloring is a simple way to do analysis. The other way we wanted to attempt this was through a neural net. This is the codebase we will submit with this project. We used open source Python code to create a color recognition algorithm that, with a little more time and development, would be trained to do color analysis on Jupiter images. The neural net could analyze the image pixel by pixel and provide a much more accurate assessment of the color patterns found in Jupiter images, thus giving us a better idea of which potential elements are in which cloud formations.
QGIS’s SCP has this same machine learning capability but we were not able to use it without assigning our Jupiter images to a coordinate reference system (CRS), also known as a projected coordinate system. Most GIS coordinate systems are used for Earth, and though there are a few used for Jupiter, geolocating the images to specific points on Jupiter is tricky. Jupiter’s gaseous atmosphere constantly shifts and moves. There are no solid points to geolocate to, besides perhaps the poles.
Further development of this hackathon project may yield a few things. First, a website interface or application in VR/AR that would allow the public to view true color, false color, and neural net images of Jupiter’s surface, to further immerse them in these magnificent images.
Second, the development of an “easier-to-use” coordinate reference system for Jupiter would help simplify GIS analysis of Jupiter’s atmosphere. The challenges associated with this are numerous but not necessarily insurmountable. As mentioned before, Jupiter’s surface clouds constantly shift and move, so any CRS would need to be fixed to the semi-permanent features of Jupiter like the Big Red Spot or the poles (there are CRS’s of Jupiter that do exist and do focus on the poles, but the scale of the images we worked with on this project presented a little opportunity for high detail analysis even if we could figure out how to georeference the images to the provided Jupiter CRSs).
It would also be nice to develop a Jupiter imaging download site that offers something similar to what the USGS Landsat site or ESA’s Sentinel site offer, which are imagery products that provide RGB, near-infrared (NIR), SWIR, thermal, and any other “bands” that Juno’s instruments can develop. Having all of these separate bands in the image products makes remote sensing analysis in GIS software much easier. It would also be an added luxury if we could receive super detailed pictures of Jupiter (similar to how Landsat and Sentinel can provide imagery down to 30m resolution), though safety considerations for Juno and other satellites mean that they cannot get too close to the planet or risk destruction by radiation.
Space Agency Data
Juno image sets taken from the JunoCam image processing website (https://www.missionjuno.swri.edu/junocam/processing):
North Equatorial Belt Southern Edge 2017-12-16
PJ15 Closest Approach 2018-09-07
P22 Jet N3 2019-09-12
PJ30 Equatorial Zone South 2020-11-08
PJ38 South Equatorial Belt 2021-11-29
PJ40 South Equatorial Belt 2022-02-25
PJ39 Northern Circumpolar Cyclones 2022-04-23
POI South Polar Region 2017-09-01
Hackathon Journey
Larry: I have some experience in hackathons but this was my first non-university one. I came into this with the goals of wanting to push the boundaries of what I knew about remote sensing/GIS in relation to astronomy as well as trying to come up with a cool idea for a project and meet cool people who are passionate about space and tech. I’m proud of the work that I put into the project even though the GIS part was minimized by the time we figured things out, and I’m proud that my team was so adaptable to the setbacks and changing project parameters. I learned that I have much more to learn in GIS analysis but that I can push myself to learn new things for a project that I’m passionate about. I’d like to thank NYC local lead Katelyn Hertel for, first of all, being a good friend and convincing me that being self taught is possible and awesome, but also for inviting me to come to this hackathon in the first place! And to my teammates Madina and Yousuf for being chill and awesome!
Madina: I enjoy participating in hackathons and find it very exciting to meet, collaborate with people and create interdisciplinary teams. I am a spatial designer and my passion in hackathons lies in creative direction, idea development, design and storytelling. During this hackathon I am happy to collaborate with my teammates Larry and Yousuf to address the visualization Jovian system challenge, who I would like to thank for a positive spirit throughout. Outer space is one of my great design interest areas. This hackathon, I have learned how to use Figma and develop my storytelling skills!
Yousuf: I have had my eye on this competition for years, but have been too intimidated to sign up until now. I regret not joining earlier! It’s a very friendly and supportive environment - local leads were very approachable and answered any questions I had. On top of that, I’ve worked on designing a neural net despite only two months of coding experience! It’s amazing what you can learn and pick up as you’re doing any challenge. It has really inspired me to continue to see where coding takes me and what I can do with it in the long run!
References
https://www.nasa.gov/mission_pages/juno/overview/index.html
https://www.missionjuno.swri.edu/#/mission
https://www.nasa.gov/solve/feature/junocam
https://agupubs.onlinelibrary.wiley.com/doi/full/10.1029/2020JE006403
https://www.vernier.com/vernier-ideas/a-quantitative-investigation-of-the-helium-spectrum/
Image by <a href="https://www.freepik.com/free-vector/realistic-metaverse-illustration_22110368.htm#query=vr&position=7&from_view=search">Freepik</a>
<a href="https://www.freepik.com/free-vector/drawn-flat-design-metaverse-illustration_22431032.htm#query=vr&position=25&from_view=search">Image by pikisuperstar</a> on Freepik
Tags
#jupiter #juno #jovian #atmosphere #metereology #weather #spectroscopy #storytelling #immersive #ar #chemistry #vr #design #ux #ui #webdesign